Medical Sonification
Sonification is the representation of any data or information through the sense of sound, as opposed to more conventional methods, such as plots, graphs, visual displays, etc. This particular project deals with the use of sound to represent medical imaging data, with a focus on supplementing existing diagnosis techniques for identifying Alzheimer’s disease.
The Data
Medical imaging data is stored in a standardized format called DICOM. The datasets that are handled in this project are three-dimensional scans of human brains that have been diagnosed with Alzheimer’s disease, with varying levels of progression. These datasets are converted into easily readable (by humans and computers) text files utilizing MATLAB’s inbuilt functions to read DICOM files.
The Sonification Tool
The magic happens in the C++ tool that I developed named SoniScan++ (the MATLAB prototype was named SoniScan, and is shown below).
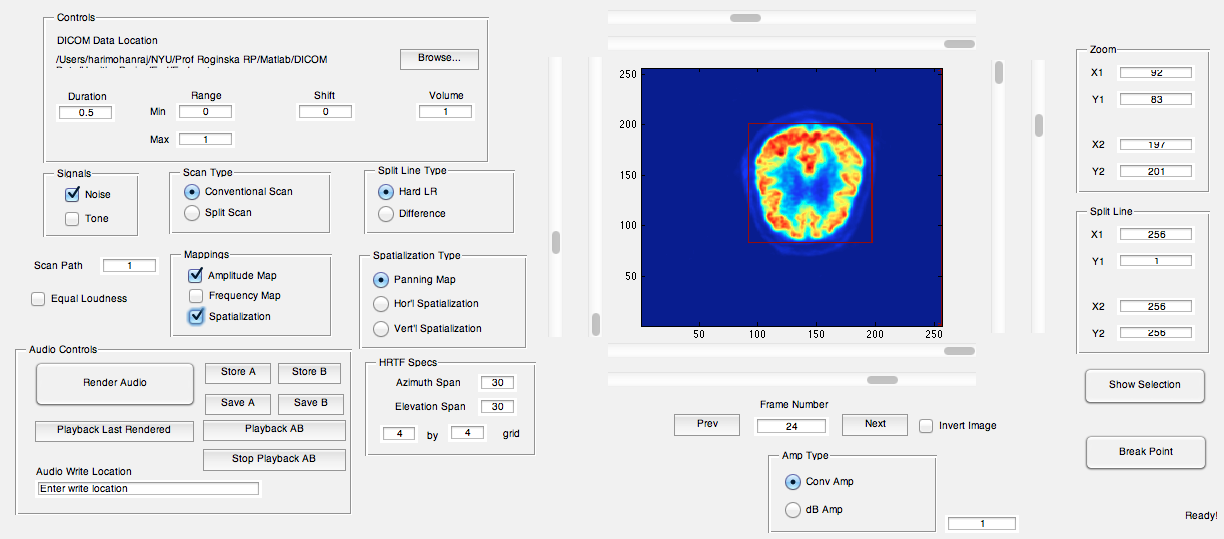
Here the user is presented with the option to “sonify” a dataset in a number of ways. Some of the sonification techniques are voxel(volumetric pixel)-to-note mappings. Here, each datapoint, or voxel, is assigned a note to play on a pre-determined scale, and the various properties of the voxel, namely its position and value, are mapped to different parameters of the note to be played, such as which instrument should play the note, or how long and loud the note should play. The result is musical piece of sorts.
A healthy brain, where pitch is mapped to the y-axis, and time to the x-axis.
A brain with severe Alzheimer's, where pitch is mapped to the y-axis, and time to the x-axis.
Another sonification technique involves dividing the brain into its lobes, computing the average intensity of each region, and mapping that intensity to the frequency of a simple tone corresponding to that region. The result is a textural drone. The results of this technique seem to be quite promising for the improvement of consistency in diagnosis of Alzheimer’s disease.
A healthy brain, where pitch is mapped to the y-axis, and time to the x-axis.
A brain with severe Alzheimer's, where pitch is mapped to the y-axis, and time to the x-axis.
This research is funded by the Clinical and Translational Science Institute, NYU Langone Medical Center.